Higher Applications of Mathematics
Course Overview
This course has four components :
Mathematical modelling, Statistics and probability,Finance, Planning and decision making
An external SQA exam is sat at the end of the course and a project must also be completed.
The standalone Higher Statistics unit award is embedded within this course.
The software packages R Studio and Excel are used.
Scholar SQA Higher Applications of Mathematics Higher Apps Past Papers
National 5 Applications SQA Advanced Higher Statistics
Mathematical Modelling
Key subskills
Modelling a situation mathematically in a given context
Defining appropriate units of measure for variables and
checking for consistency
Evaluating the effects of error and tolerances within
mathematical models
Evaluating and interpreting the output of mathematical
models
Analysing mathematical models and suggesting possible
improvements
Using software
effectively in calculations
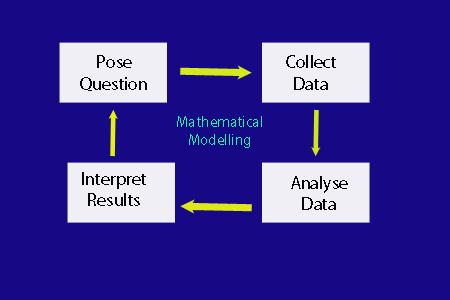
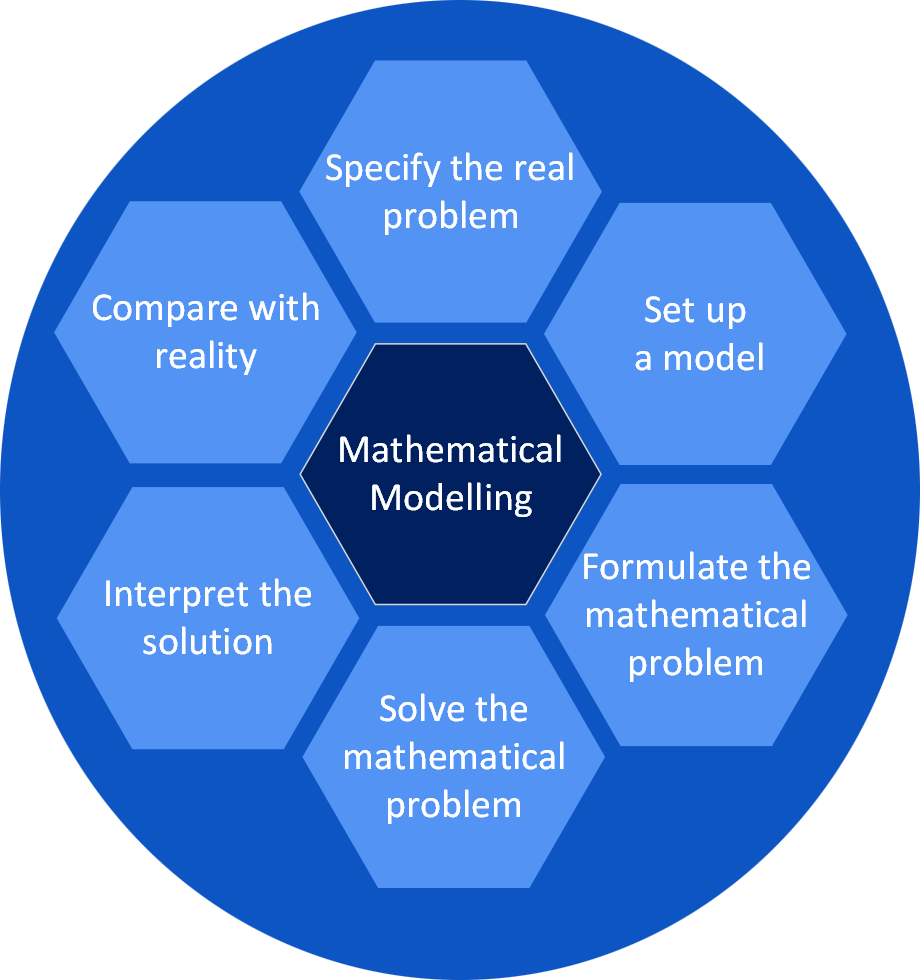
Mathematical Modelling Modelling StagesWorked ExampleFermi Problems
Depth Time Graphs : GeoGebra University of Plymouth: Mathematical Modelling
An Introduction to SQA Statistics Higher UnitStats Award : R Studio guide The Comprehensive R Archive Network Linear regression using R (LibreTexts)
Statistics and probability
Key subskills
Applying statistical skills to basic probability.
Applying statistical literacy skills to data .
Applying statistical skills to correlation and linear regression .
Applying statistical skills to data analysis, interpretation and communication
Finance
Key subskills
Applying mathematical skills to calculating present and future values of monetary payments.
Applying mathematical skills to solving problems related to personal financial products and transactions and analysing the results.
Applying personal
financial planning skills .
Course Overview and Learning Outcomes
Mathematical modelling
- Modelling a situation mathematically in a given context
- Defining appropriate units of measure for variables and checking for consistency
- Evaluating the effects of error and tolerances within mathematical models
- Evaluating and interpreting the output of mathematical models
- Analysing mathematical models and suggesting possible improvements
- Using software effectively in calculations
Planning and decision making
- Representing compound projects by activity networks using activity-on-node representation, for example Programme Evaluation and Review Technique (PERT) charts
- Using systematic methods to find early and late times for activities, and then identifying critical activities and finding critical paths
- Using Gantt charts to represent project activities
- Understanding and interpreting risk by calculating the expected value of costs and benefits of decisions
- Applying expected value to real-life contexts and understanding this is an important part of decision making
Finance
- Understanding the concept of capital and interest and performing calculations involving effective rates of interest
- Calculating the present value and accumulated value of a single payment and a series of payments
- Understanding the purpose of credit cards and loans
- Solving and analysing problems relating to credit cards and loans
- Analysing the risks associated with credit cards and loans
- Understanding the purpose of savings products
- Solving and analysing problems relating to savings products
- Analysing the risks associated with savings products
- Understanding the purpose of insurance products
- Analysing the risks associated with insurance products
- Understanding monetary concepts, applying these in financial calculations, and interpreting their impacts
- Analysing and interpreting the risks associated with financial planning strategies
Statistics and probability
- Constructing tree diagrams and Venn diagrams
- Carrying out basic calculations involving the combination of events, where information may be displayed in tables or graphs
- Constructing and interpreting statistical diagrams
- Interpreting the distribution of data, with particular reference to symmetry, normality, and skewness
- Deriving, understanding, and interpreting sample measures of location and dispersion, including mean and standard deviation, and median and interquartile range
- Interpreting and constructing scatter plots
- Using simple linear regression
- Interpreting the slope and intercept parameters in relation to data
- Using linear models for prediction
- Assessing the accuracy of predictions
- Understanding and interpreting correlations
- Understanding the applicability of Pearson’s product-moment correlation coefficient
- Exploring trends in data
- Formulating research questions
- Interpreting and reporting the results of a hypothesis test
- Generating, understanding, and interpreting confidence intervals
- Performing simple analysis using t-tests and paired t-tests
- Using z-tests for two proportions
- Understanding how errors can arise in statistical testing, including confounding variables
- Interpreting and relating results of a hypothesis test to the original research question
Books
Printed resources available at Amazon
As an Amazon Associate I earn from qualifying purchases.
 © Alexander Forrest