Pie charts
A pie chart is a way of visually representing data.
The larger the slice of pie, the greater the number of items in that category.
An S1 class was asked to vote for their favourite crisps from a selection of flavours.
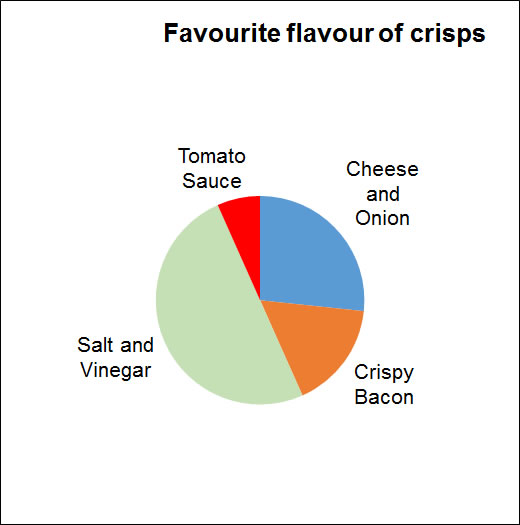
The pie chart shows that the order of preference was Salt and Vinegar, then Cheese and Onion, Crispy Bacon and Tomato Sauce.
Reading pie charts
600 people were asked to select a biscuit.
The results are shown in the pie chart that follows.
Calculate how many people picked each type of biscuit.
Calcute the fraction of the circle and multiply by the total in the sample.
Check: 150 + 300 + 100 + 50 = 600
Firstly, collect the data.
Here is a tally chart for the crisps example above.
Next, find the fraction of the data for each category.
Simplify if possible.
To find the angle needed to draw the pie chart, multiply the fraction by 360°.
Then measure the angles and draw the lines.
Don't forget to label each part.

Pie charts can be used to make predictions: relative frequency .