Project Management
Precedence Tables
Precedence tables map out the steps needed to complete a project. A list of tasks is created along with their completion times.
An outhouse is being repurposed as a workshop. The earth floor is to be replaced with concrete mixed and poured onsite.
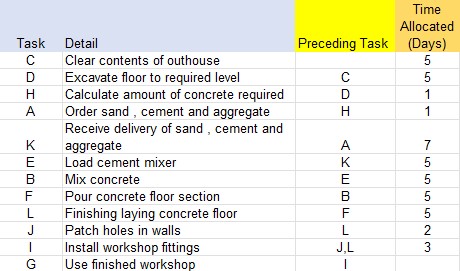
Here is a list of tasks:
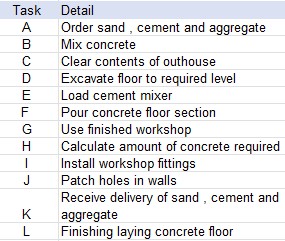
Nothing can happen before the outhouse has been cleared and the floor excavated.
Here is the order of tasks:
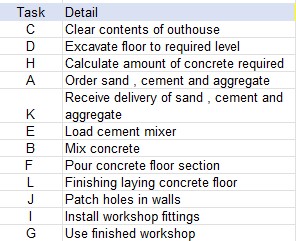
Some steps — called dependencies — can only begin after others have started or finished.
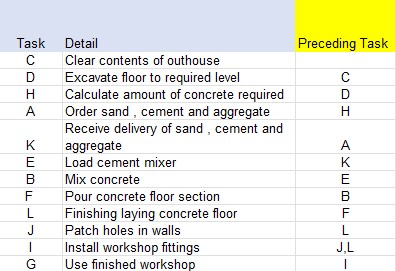
Before concrete mixing begins, materials must be delivered. Loading, mixing and pouring must be repeated until the floor is complete. Installing workshop fittings can only happen once the floor and walls are finished.
As well as knowing the order of tasks, their timings must also be known.
Clearing the outhouse: 5 days
Excavating the floor: 5 days
Calculating and ordering materials: 1 day
Delivery of materials: 7 days
Laying the floor: 5 days
Patching holes in walls: 2 days
Installing fittings: 3 days
If all timings are added, the total is 44 days. However, this includes repeated sub‑activities and ignores tasks that finish on the same day.
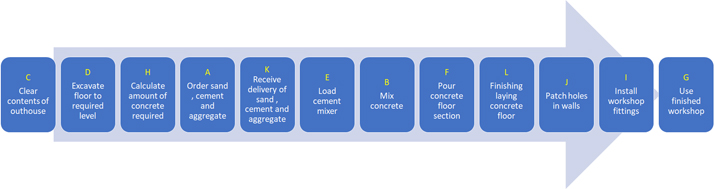
The critical path is the longest time from start to finish.
It is shown as the large arrow in this network diagram:
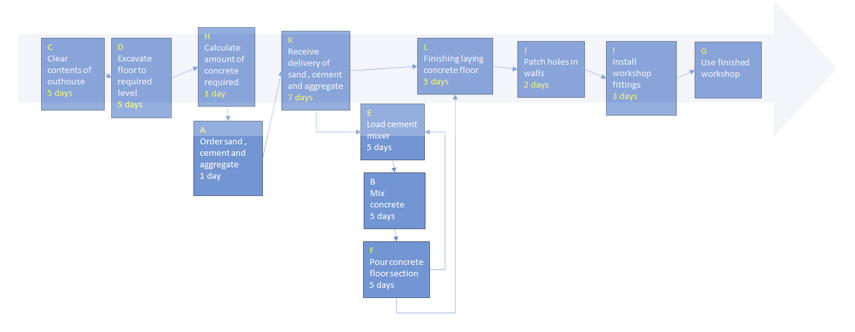
5 + 5 + 1 + 7 + 5 + 2 + 3 = 28 days are required. The workshop can be used on the 29th day.
Find the critical path for the following precedence table:
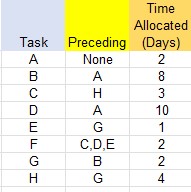
First, complete a network diagram:
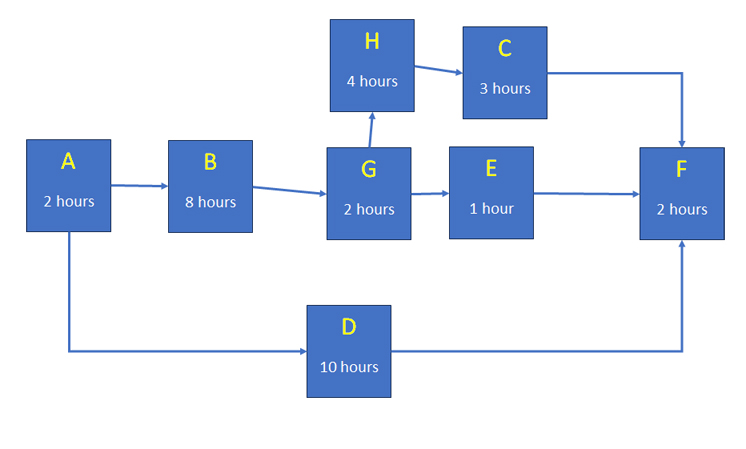
There are three paths:
A → B → G → E → F takes 2 + 8 + 2 + 1 + 2 = 15 hours
A → B → G → H → C → F takes 2 + 8 + 2 + 4 + 3 + 2 = 21 hours
A → D → F takes 2 + 10 + 2 = 14 hours
The critical path is A → B → G → H → C → F (21 hours).
Examples at CIMT.org.uk
Gantt Chart
A Gantt chart (named after Henry Gantt) is a bar chart showing tasks on the y‑axis and time on the x‑axis.
Basic Gantt chart for the data above:
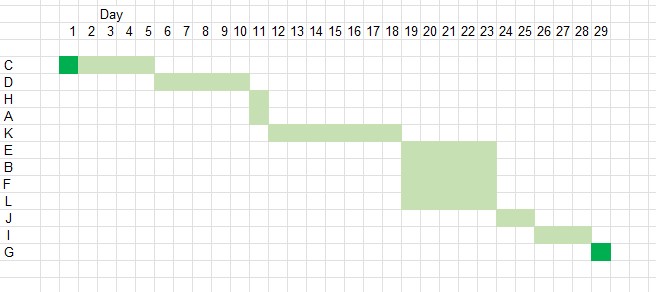
The workshop can be used on the 29th day.
PERT Chart
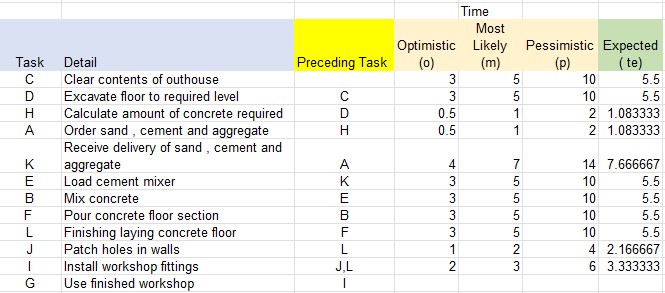
PERT (Program Evaluation and Review Technique) was developed by the US Navy in 1957. It helps project managers create realistic schedules by assigning three time estimates:
- Optimistic time (o): Minimum possible time
- Most likely time (m): Best estimate
- Pessimistic time (p): Maximum possible time
The expected time is:
Expected time calculation for the data above:
In a PERT diagram, nodes represent activities or milestones, connected by arrows. Some charts include extra data such as start/finish dates.
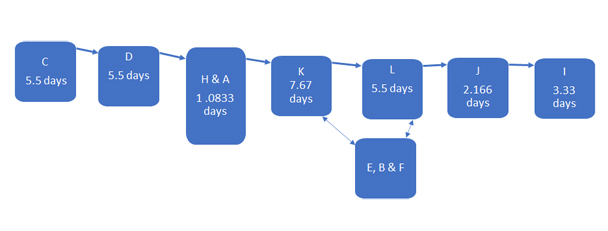
The critical path is 30.7493 days.
Learn more at Simplilearn.com
