Sets
A mathematical set is a collection of distinct objects such as numbers, letters, shapes, or functions. The objects in a set are called its elements or members.
Sets can be defined by listing elements inside curly braces, or by giving a rule describing membership.
The set \(\{1,2,3\}\) contains only the numbers 1, 2, and 3.
The set \(\{x : x^2\}\) contains square numbers.
Set Notation
\[ \begin{aligned} \textbf{Notation} \qquad\qquad\qquad\qquad\qquad\qquad\qquad\textbf{Examples} \\[1em] \in \; \text{ means “is an element of”} \qquad 2 \in \{1,2,3,4\} \\[0.8em] \notin \; \text{ means “is not an element of”} \qquad 2 \notin \{1,3,5\} \\[0.8em] \cup \; \text{ means “union of sets”} \qquad \{1,2,3\} \cup \{3,4,8\} = \{1,2,3,4,8\} \\[0.8em] \cap \; \text{ means “intersection of sets”} \qquad \{1,2,3\} \cap \{3,4,8\} = \{3\} \\[0.8em] \subset \; \text{ means “subset of a set”} \qquad \{1,2,3\} \subset \{1,2,3,4,8\} \\[0.8em] \supset \; \text{ means “superset of a set”} \qquad \{1,2,3,4,8\} \supset \{1,2,3\} \\[0.8em] \not\subset \; \text{ means “not a subset of a set”} \qquad \{10,20,30\} \not\subset \{1,2,4,8\} \\[0.8em] \varnothing \;\text{ or }\; \{\} \; \text{denotes the empty set} \end{aligned} \]
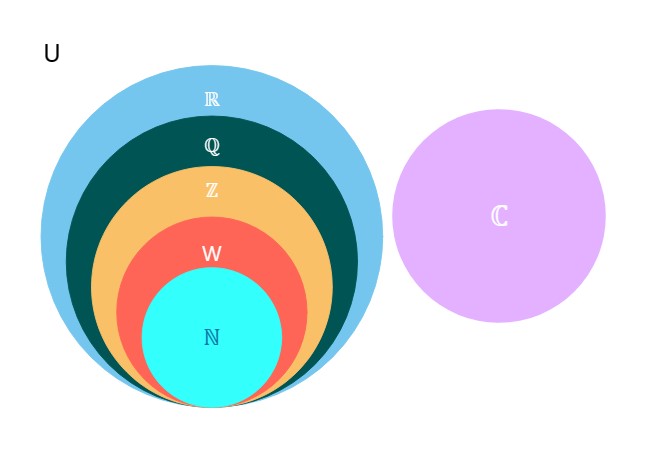
Common Sets
\[ \mathbb{N} = \{1,2,3,4,\dots\} \text{is the set of } \textbf{natural } \text{numbers used in counting. 1 to } \infty \ \]
\[ \mathbb{W} = \{0,1,2,3,4,\dots\} \text{is the set of } \textbf{whole } \text{numbers zero to } \infty \]
\[ \mathbb{Z} = \{\dots,-2,-1,0,1,2,\dots\} \text{is the set of } \textbf {integers} \text{: positive and negative whole numbers} \]
\[ \begin{aligned} \mathbb{Q} &\text{ is the set of rational numbers or }\textbf {quotients.} \\[0.6em] &\text{These are all numbers which can be expressed as} \\[0.6em] &\text{a fraction } \frac{a}{b} \text{ where both } a \text{ and } b \text{ are integers,} \\[0.6em] &\text{and } b \text{ is not zero.} \end{aligned} \]
\[ \begin{aligned} \mathbb{R} &\text { is the set of } \textbf {real } \text {numbers } \{ -\infty , \ldots , \infty \} \\[0.6em] &\text{This includes all numbers, rational and irrational.} \end{aligned} \]
\[ \begin{aligned} \mathbb{C} &\text{ is the set of } \textbf {complex } \text{numbers, } a + b i \\[0.6em] &\text{where } a \text{ and } b \text{ are real, and } i \text{ is the imaginary number } \sqrt{-1}. \end{aligned} \]
\[ \mathbb{N} \;\subset\; \mathbb{W} \;\subset\; \mathbb{Z} \;\subset\; \mathbb{Q} \;\subset\; \mathbb{R} \]
\[ \{\, x : x \lt 5 \,\} = \{\, \ldots,\,-3,\,-2,\,-1,\,0,\,1,\,2,\,3,\,4 \,\} \] \[ \{\, x : x \text{ is a factor of } 12 \,\} = \{\, 1,\,2,\,3,\,4,\,6,\,12 \,\} \]
\[ \begin{aligned} \{\, x : x^{2} + 2x + 3 = 0,\; x \in \mathbb{R} \,\} = \{\, \} \end{aligned} \]
\[ \begin{aligned} \{\, x : 5 \lt x \lt20,\; x \text{ prime} \,\}= \{\, 7,\, 11,\, 13,\, 17,\, 19 \,\} \end{aligned} \]
\[ \begin{aligned} \{\, x : \sin x^\circ = 0,\; 0 \le x \le 360,\; x \in \mathbb{R} \,\}= \{\, 0,\, 180,\, 360 \,\} \end{aligned} \]
Venn Diagrams
Venn diagrams show relationships between sets. \(U\) represents the Universal set.
A ∪ B: The union of sets A and B
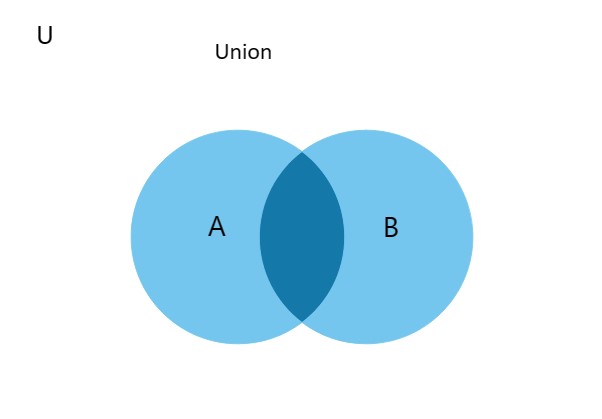
The joining of sets A and B.
A ∩ B: The intersection of sets A and B
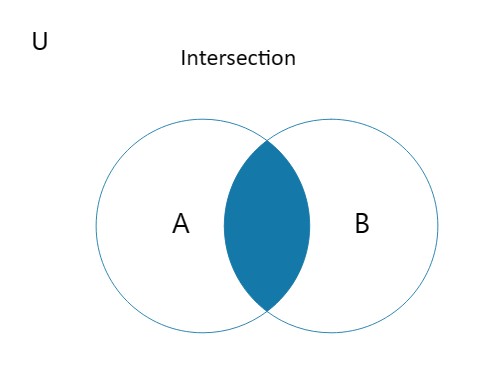
The elements in both A and B.
A′ or AC: The complement of A
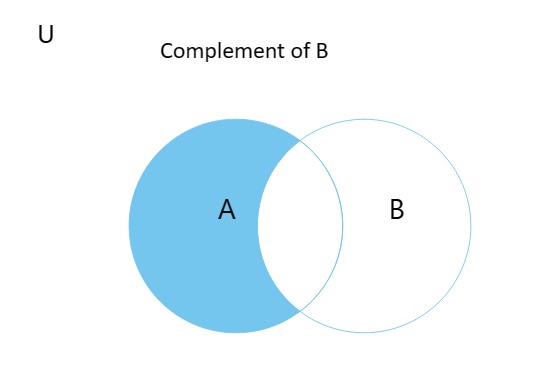
The elements not in A.
A − B: The difference of A and B
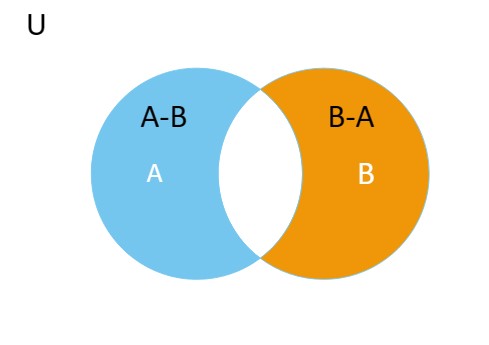
The elements in A that are not in B.
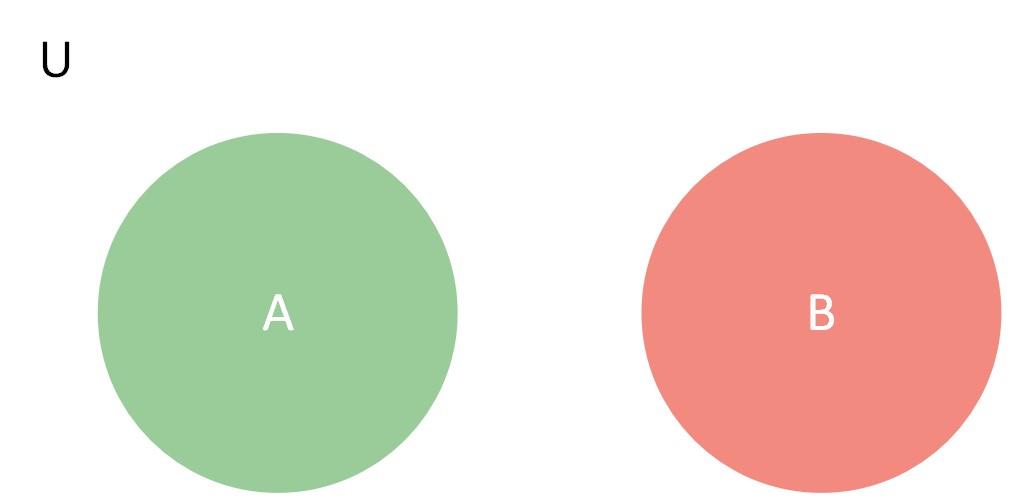
Mutually exclusive: cannot happen at the same time
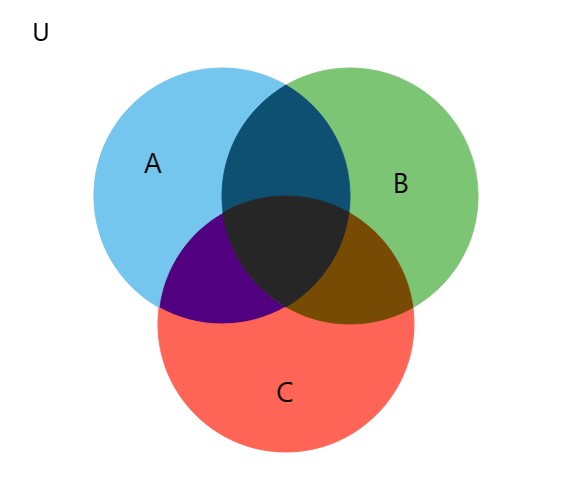
Venn diagrams can involve more than two sets:
50 people were asked if they had dogs or cats.
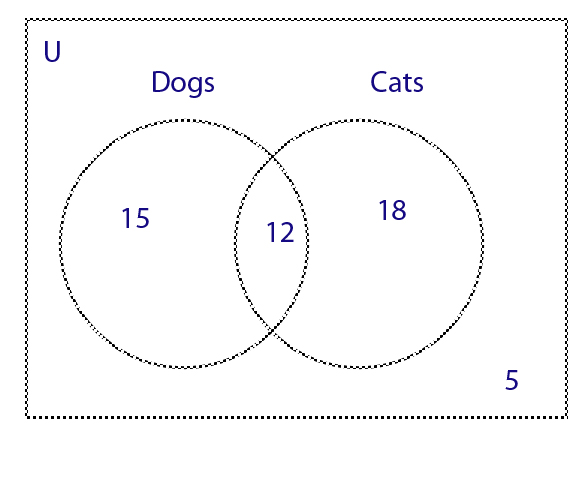
27 had dogs, 30 had cats, 5 had neither.
15 had dogs only, 18 had cats only, 12 had both.
Let A = dogs, B = cats.
A ∪ B = 15 + 12 + 18 = 45
A ∩ B = 12
A′ = 50 − 30 = 20
B′ = 50 − 27 = 23
A survey of pet owners is shown:

- 12 + 3 + 5 + 7 = 27 people had fish
- 3 people had dogs and fish only
- 16 + 8 + 18 + 3 + 5 + 7 + 12 = 69 people took part
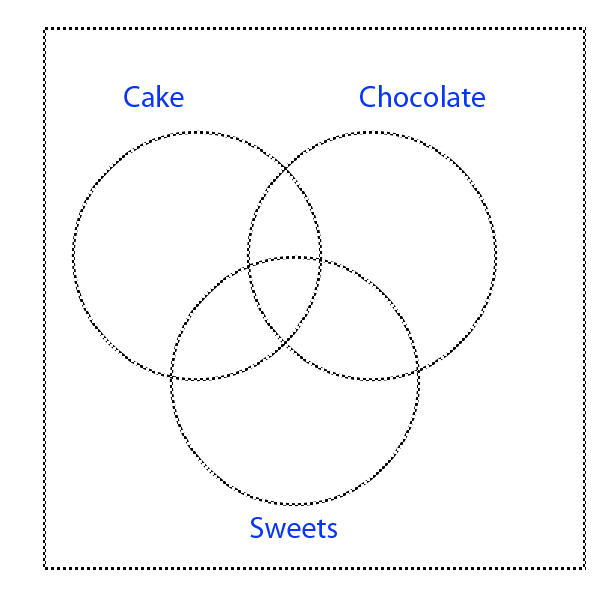
Probability and Venn Diagrams
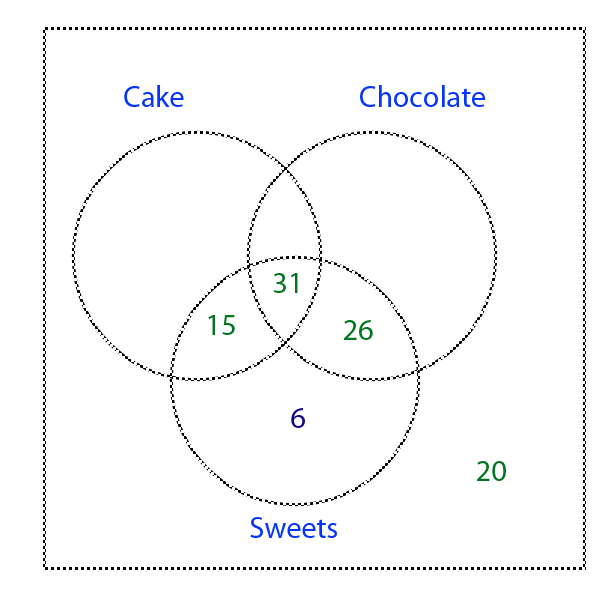
A survey was carried out on 120 pupils:
- 78 like sweets
- 74 like chocolate
- 53 like cake
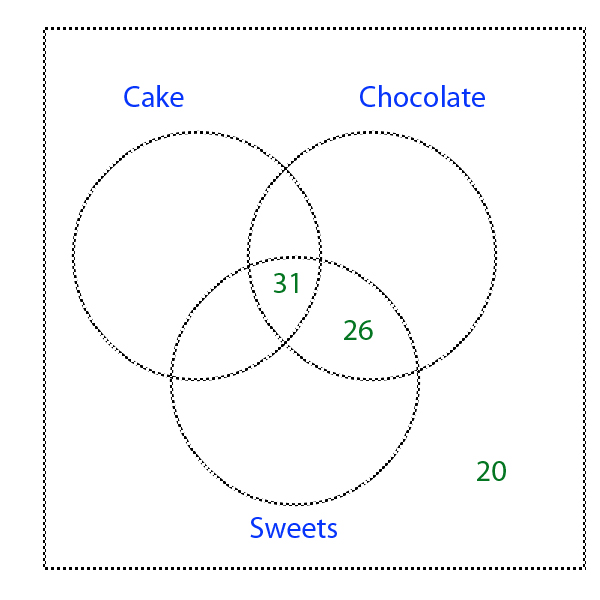
- 57 like sweets and chocolate
- 46 like sweets and cake
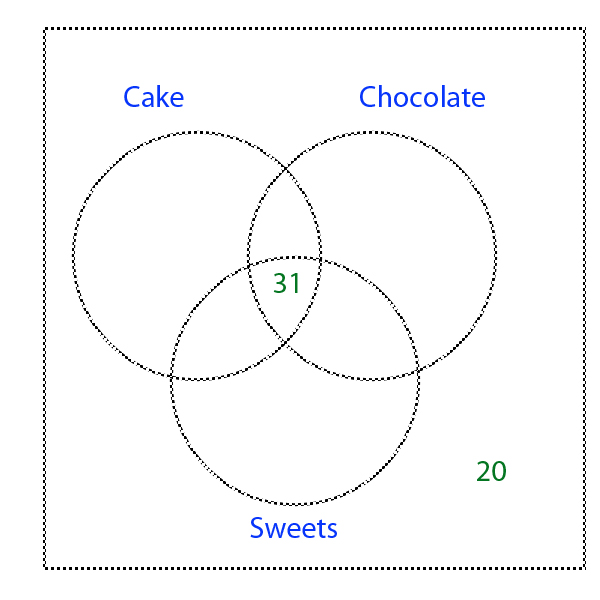
- 31 like all three
- 20 like none
Complete the Venn diagram and calculate the probability that a pupil selected at random likes both chocolate and cake.
31 pupils like all three options, so 31 is placed in the centre. The 20 pupils who like none are placed outside the circles.
57 pupils like chocolate and sweets. Since 31 are already counted, the remaining 26 go in the chocolate–sweets overlap.
46 pupils like sweets and cake. Subtracting the 31 already counted gives 15 in the sweets–cake overlap.
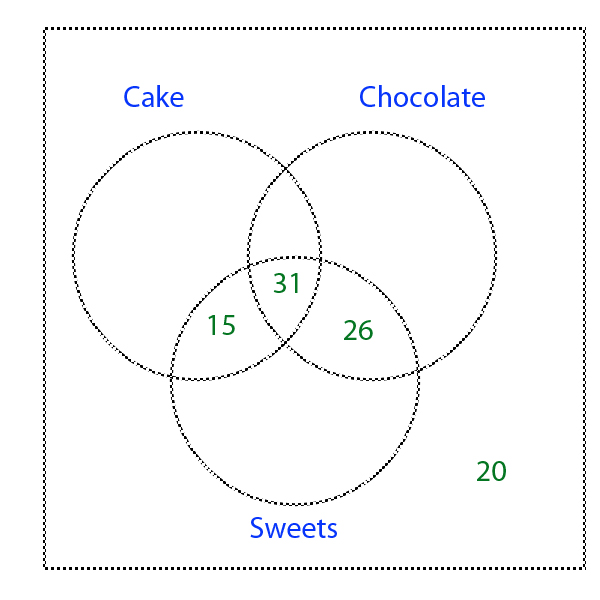
78 pupils like sweets. Since 15 + 31 + 26 = 72, the sweets‑only region contains 6 pupils.
Let:
- \(x\) = cake only
- \(y\) = cake and chocolate only
- \(z\) = chocolate only
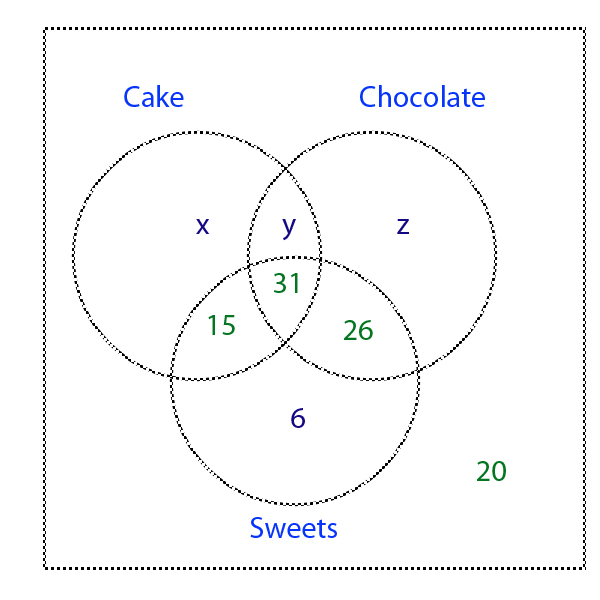
100 pupils like at least one option (120 total − 20 none).
53 pupils like cake:
Substitute into the earlier equation:
So 15 pupils like chocolate only.

74 pupils like chocolate:
So 2 pupils like cake and chocolate only.

Finally:
So 5 pupils like cake only.
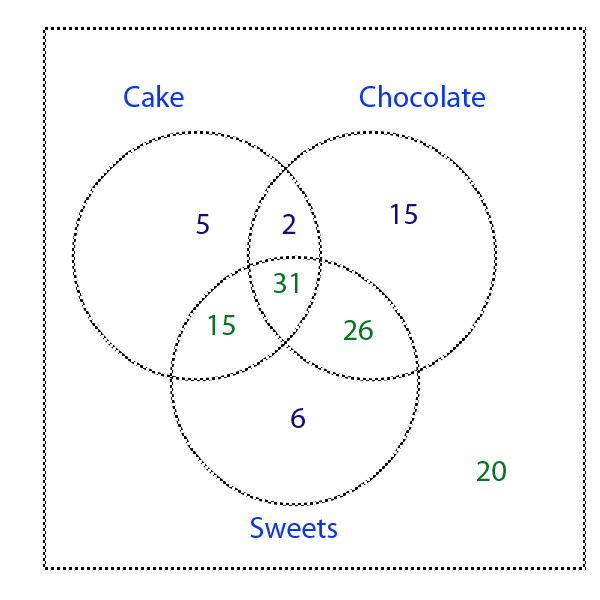
Probability:
33 pupils like both chocolate and cake.
Functions
A function consists of two sets — the domain and codomain — and a rule that maps each element of the domain to exactly one element of the codomain.
Domain: set of input values
Codomain: set of possible outputs
Range: set of actual outputs
So:
\[ \begin{aligned} \text{Domain} \;&A = \{\, a,\, b,\, c,\, d,\, e \,\} \\[0.8em] \text{Codomain} \;&B = \{\, q,\, r,\, s,\, t,\, u,\, v \,\} \\[0.8em] \text{Range} \;&\{\, q,\, r,\, s,\, t,\, v \,\} \end{aligned} \]
\[ \begin{aligned} f(x) &= x^{2} + 2,\quad x \in \{-3,-2,-1,0,1,2,3\} \\[1em] \text{a) State the domain} \\[0.8em] \text{b) State the range} \end{aligned} \]
\[ \text{ a) The domain is } \{ -3,\,-2,\,-1,\,0,\,1,\,2,\,3 \} \]
\[ \begin{aligned} \text{b) } f(x) &= x^{2} + 2 \\[0.8em] f(-3) &= (-3)^{2} + 2 = 9 + 2 = 11 \\[0.4em] f(-2) &= (-2)^{2} + 2 = 4 + 2 = 6 \\[0.4em] f(-1) &= (-1)^{2} + 2 = 1 + 2 = 3 \\[0.4em] f(0) &= 0^{2} + 2 = 0 + 2 = 2 \\[0.4em] f(1) &= 1^{2} + 2 = 1 + 2 = 3 \\[0.4em] f(2) &= 2^{2} + 2 = 4 + 2 = 6 \\[0.4em] f(3) &= 3^{2} + 2 = 9 + 2 = 11 \\[1.0em] \text{The range is } \{\,2,\,3,\,6,\,11\,\} \end{aligned} \]
