Sketching Trigonometric Graphs
Refresher: basic trig graphs
\( y = \sin x \)
\( y = \cos x \)
\( y = \tan x \)
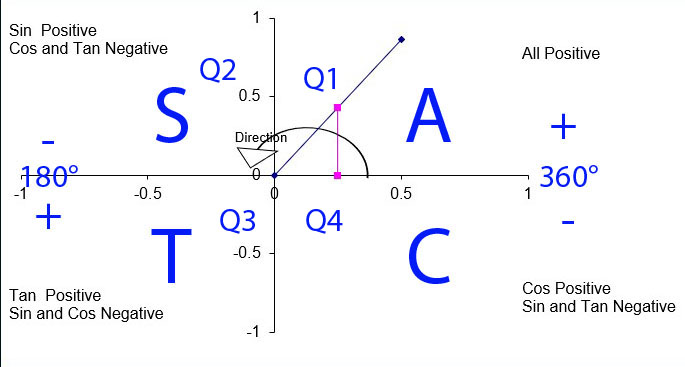
CAST Diagram
A trig graph can be expressed in the form:
\[ y = a\sin(bx - c) + d \]
\(b\) = number of cycles in \(360^\circ\)
\(c\) = horizontal shift
\(d\) = vertical shift
To sketch the graph:
- Start with the basic shape.
- Use the number of cycles (b) to calculate the period.
- Use the horizontal shift (c) to slide the graph into position.
- Use the amplitude (a) to scale vertically and calculate the starting minimum and maximum values.
- Use the vertical shift (d) to move the graph and calculate the actual minimum and maximum values.
Sketch the graph of:
\[ y = 3\sin(x - 30^\circ) + 1 \]
A basic sine graph is translated \(30^\circ\) right, then scaled by 3, then moved up 1.
The period is \(360^\circ\) since \(b = 1\).
Key points on a basic sine graph are:
\[ (0,0),\ (90^\circ,1),\ (180^\circ,0),\ (270^\circ,-1),\ (360^\circ,0) \]
Translating these points:
The maximum value is 4 and the minimum value is −2.
To find where the graph cuts the x‑axis, solve:
\[ 0 = 3\sin(x - 30^\circ) + 1 \]
\[ \begin{alignedat}{2} 0 &= 3\sin(x - 30^\circ) + 1 \\[1.2em] -1 &= 3\sin(x - 30^\circ) \\[1.2em] -\tfrac{1}{3} &= \sin(x - 30^\circ) \\[1.2em] \sin^{-1}\!\left(-\tfrac{1}{3}\right) &= x - 30^\circ \end{alignedat} \]
\[ \begin{alignedat}{1} -19.471222^\circ &= x - 30^\circ \\[1.4em] \text{Solution:} \\[0.6em] \text{sine is negative in quadrants 3 and 4} \\[1.4em] \text{Acute angle} &= 19.471222^\circ \end{alignedat} \]
\[ \begin{alignedat}{2} \text{Quadrant 4:} \\[0.6em] 360^\circ - 19.471222^\circ &= x - 30^\circ \\[1.0em] 340.528^\circ &= x - 30^\circ \\[1.0em] x &= 370.528^\circ \\[1.0em] x &= 370.53^\circ\ \text{(2 d.p.)} \end{alignedat} \]
\[ \begin{alignedat}{2} \text{Quadrant 3:} \\[0.6em] 180^\circ + 19.471222^\circ &= x - 30^\circ \\[1.0em] 199.47122^\circ &= x - 30^\circ \\[1.0em] x &= 229.47122^\circ \\[1.0em] x &= 229.47^\circ\ \text{(2 d.p.)} \end{alignedat} \]
Putting all of this together: