Plotting Straight Line Graphs
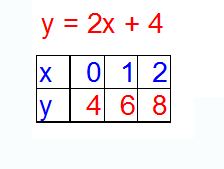
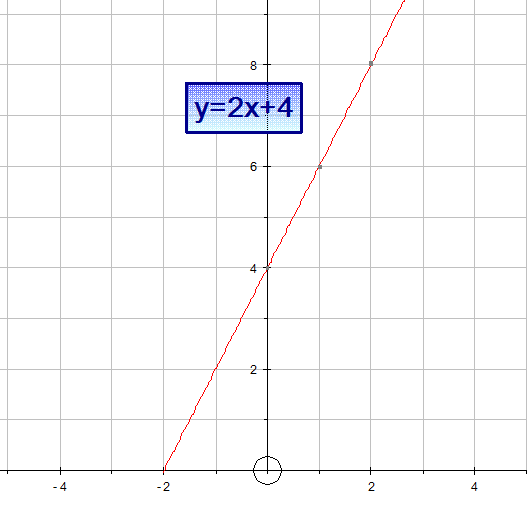
To plot a graph from its equation:
- Re‑arrange the equation into the form y = mx + c.
- Pick 3 sensible values for x (including 0), then solve for y.
- Plot the points on a grid.
- Join them with a straight line that crosses the y‑axis.
- The graph will cut the y‑axis at (0, c) and have gradient m.