Constant Speed Example
Example
A vehicle is travelling at a constant speed of 4 m/s for a time duration of 5 seconds.
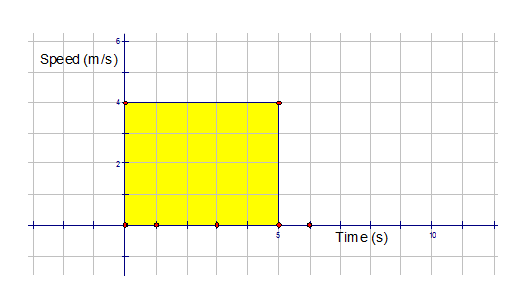
What distance is travelled?
\[
D = \text{Speed} \times \text{Time}
\]
\[
D = 4 \times 5 = 20 \text{ m}
\]
The area under the graph is a rectangle:
\[
A = L \times B = 5 \times 4 = 20
\text { units} ^2. \]
Piecewise Speed Example
Example
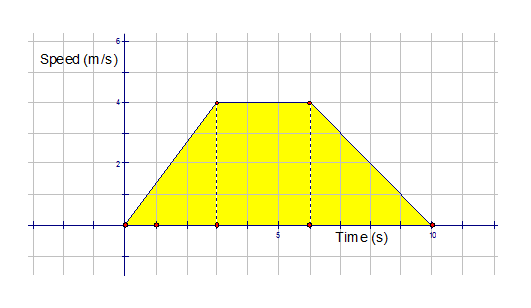
A vehicle accelerates from rest to 4 m/s in 3 seconds, maintains this speed for 3 seconds, then decelerates to rest over 4.5 seconds.
\[
\text{Area}_{\text{left-hand triangle}}
= \tfrac12 \times \text{base} \times \text{height}
\]
\[
= \tfrac12 \times 3 \times 4
\]
\[
= 6\ \text{units}^{2}
\]
\[
\text{Area}_{\text{rectangle}}
= \text{base} \times \text{height}
\]
\[
= 3 \times 4
\]
\[
= 12\ \text{units}^{2}
\]
\[
\text{Area}_{\text{right-hand triangle}}
= \tfrac12 \times \text{base} \times \text{height}
\]
\[
= \tfrac12 \times 4 \times 4
\]
\[
= 8\ \text{units}^{2}
\]
Total area = 26 units²
The vehicle travels 26 m.
Newton’s Equations of Motion
\[
v = u + at
\]
\[
s = ut + \tfrac12 at^{2}
\]
\[
v^{2} = u^{2} + 2as
\]
\[
a = \text{acceleration}
\]
\[
v = \text{final velocity}
\]
\[
u = \text{initial velocity}
\]
\[
t = \text{time taken}
\]
\[
s = \text{distance travelled}
\]
The three areas can be checked using Newton’s equations:
For the left hand triangle
\[
a = \; ?
\]
\[
v = 4\ \text{m/s}
\]
\[
u = 0\ \text{m/s}
\]
\[
t = 3\ \text{s}
\]
\[
v = u + at
\]
\[
v - u = at
\]
\[
a = \frac{(v - u)}{t}
\]
\[
a = \frac{(4 - 0)}{3}
\]
\[
a = \frac{4}{3}\ \text{m/s}^{2}
\]
\[
s = ut + \tfrac12 at^{2}
\]
\[
s = 0 \times 3 + \tfrac12 \left(\frac{4}{3}\right) \times 3^{2}
\]
\[
s = 0 + \tfrac12 \times \frac{4}{3} \times 9
\]
\[
s = 6\ \text{m}
\]
For the rectangle
\[
a = 0
\]
\[
v = 4\ \text{m/s}
\]
\[
u = 4\ \text{m/s}
\]
\[
t = 3\ \text{s}
\]
\[
s = ut + \tfrac12 at^{2}
\]
\[
s = 4 \times 3 + \tfrac12 \times 0 \times 3^{2}
\]
\[
s = 12 + 0
\]
\[
s = 12\ \text{m}
\]
For the right hand triangle
\[
a = \; ?
\]
\[
v = 0\ \text{m/s}
\]
\[
u = 4\ \text{m/s}
\]
\[
t = 4\ \text{s}
\]
\[
v = u + at
\]
\[
v - u = at
\]
\[
a = \frac{(v - u)}{t}
\]
\[
a = \frac{(0 - 4)}{4}
\]
\[
a = -1\ \text{m/s}^{2}
\]
\[
s = ut + \tfrac12 at^{2}
\]
\[
s = 4 \times 4 + \tfrac12 \times (-1) \times 4^{2}
\]
\[
s = 16 + \tfrac12 \times (-1) \times 16
\]
\[
s = 16 - 8
\]
\[
s = 8\ \text{m}
\]
The vehicle does indeed travel 26 m.
Accelerating Vehicle Example
Example
A vehicle accelerates according to the curve:
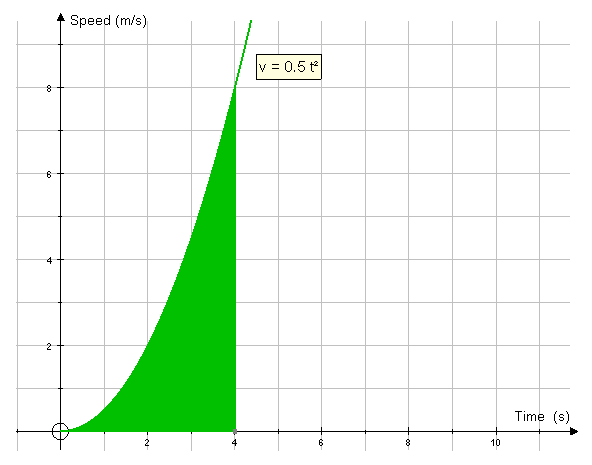
Find the distance travelled in the first 4 seconds.
Split the curve into 0.5-second intervals to estimate upper and lower bounds.
Given: \(v = 0.5t^2\)
| Time (s) | t | 0.5 | 1 | 1.5 | 2 | 2.5 | 3 | 3.5 | 4 |
| Speed (m/s) | v | 0.125 | 0.5 | 1.125 | 2 | 3.125 | 4.5 | 6.125 | 8 |
Lower Bound of the Area
The lower bound of the area under the curve
is the sum of the areas of the rectangles drawn to the right of the curve.
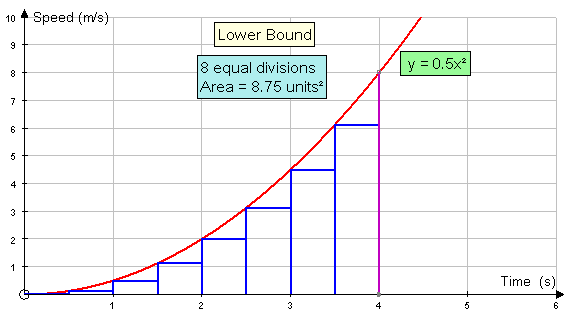
\[
A_{\text{lower}} = 0.5(0 + 0.125 + 0.5 + 1.125 + 2 + 3.125 + 4.5 + 6.125)
\]
\[
A_{\text{lower}} = 8.75\text{units}^{2} \]
Upper Bound of the Area
The upper bound of the area under the curve
is the sum of the areas of the rectangles drawn to
the left of the curve.
\[
A_{\text{upper}} = 0.5(0.125 + 0.5 + 1.125 + 2 + 3.125 + 4.5 + 6.125 + 8)
\]
\[
A_{\text{upper}} = 12.75
\text{units}^{2} \]
Convergence of Upper and Lower Bounds
The true area under the graph lies somewhere
between these two values.
Increasing the number of rectangles helps:-
Eventually, both the upper and lower bounds converge to a limit.
This limit is the area under the graph.
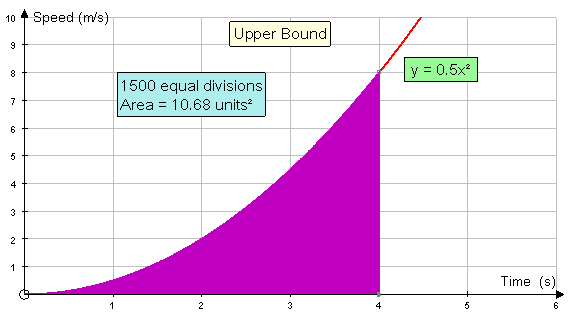
The area converges to approximately 10.67 units².
The Area Function
The area between the graph of \(y = f(x)\) and the x-axis, starting at \(x = 0\),
is called the area function \(A(x)\).
Go to Area Function →
