Basic Statistics
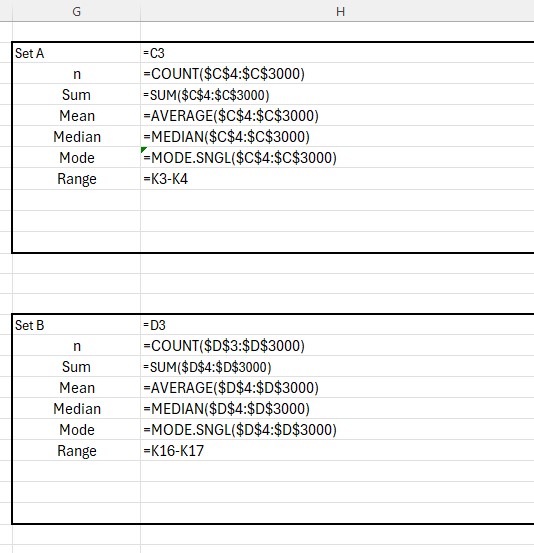
Number of bits of data: =COUNT(range)
Sum of data: =SUM(range)
Mean: =AVERAGE(range)
Median: =MEDIAN(range)
Mode: =MODE.SNGL(range)
Excel can be used for calculating statistics.
Number of bits of data: =COUNT(range)
Sum of data: =SUM(range)
Mean: =AVERAGE(range)
Median: =MEDIAN(range)
Mode: =MODE.SNGL(range)
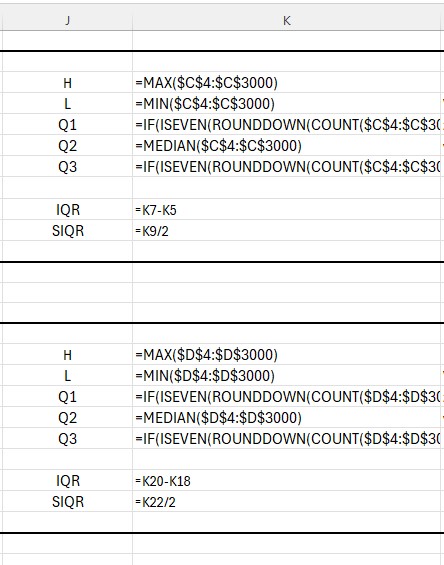
Highest (H): =MAX(range)
Lowest (L): =MIN(range)
Lower Quartile (Q1)
Using =QUARTILE.INC(data,1) can give unexpected values, because Excel calculates quartiles as percentiles rather than medians of halves.
This SMALL‑based formula works reliably:
Median (Q2): =MEDIAN(range)
Upper Quartile (Q3)
Excel’s =QUARTILE.INC(data,3) may also behave unexpectedly.
This LARGE‑based formula works reliably:
Range: =H − L
IQR: =Q3 − Q1
SIQR: =IQR / 2
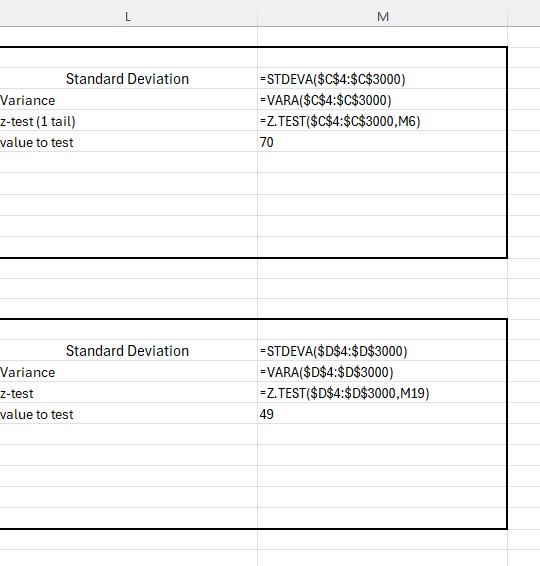
Standard Deviation: =STDEVA(range)
Variance: =VARA(range)
Z‑test (one‑tail): =Z.TEST(range, value)
Pearson correlation: =PEARSON(range1, range2)
t‑test (1‑tail, paired): =T.TEST(range1, range2, 1, 1)
t‑test (2‑tail, paired): =T.TEST(range1, range2, 2, 1)
t‑test (2‑tail, equal variance): =T.TEST(range1, range2, 2, 2)
t‑test (2‑tail, unequal variance): =T.TEST(range1, range2, 2, 3)
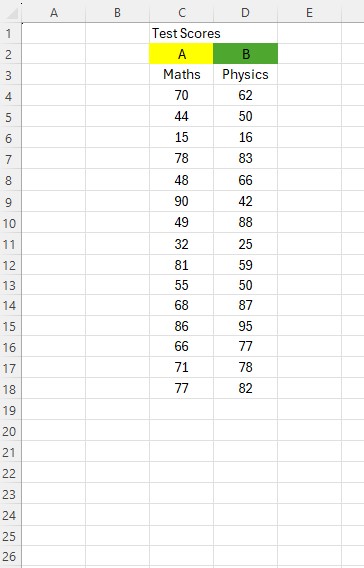
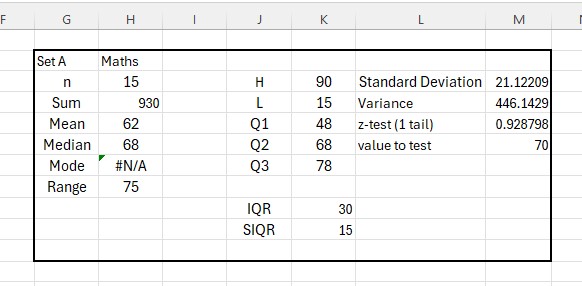
Test scores for Maths and Physics tests are compared.
The spreadsheet is set up with data set A in cells C4:C3000 and data set B in cells D4:D3000.
Summary of Maths data:
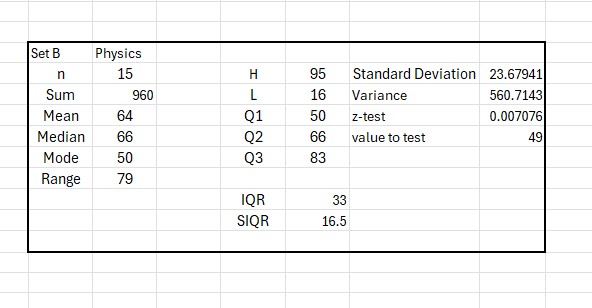
Summary of Physics data:
Show Formula view:

Formula sheet: