Terminology
μ is the population mean
σ is the standard deviation
r is Pearson’s product‑moment correlation coefficient
Φ (phi coefficient) measures association between two binary variables
Interpretation, correlation, comparisons and conclusions
μ is the population mean
σ is the standard deviation
r is Pearson’s product‑moment correlation coefficient
Φ (phi coefficient) measures association between two binary variables
This number, between −1 and 1, is commonly used to measure the strength and direction of a relationship.
r = 0 → no correlation
r > 0 → positive correlation
r < 0 → negative correlation
If r = 1 or r = −1, the line of best fit falls exactly on the data.
If r > 0.5 or r < −0.5, the line of best fit falls close to the data points, giving a strong relationship.
Main equation:
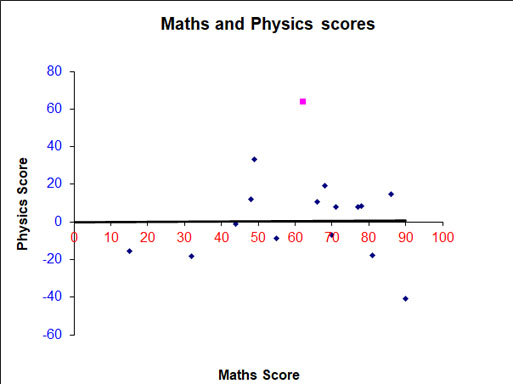
Using the data from the line of best fit above:

Write columns for x, x², y, y² and xy.
Add up each column to get Σx, Σx², Σy, Σy² and Σxy.
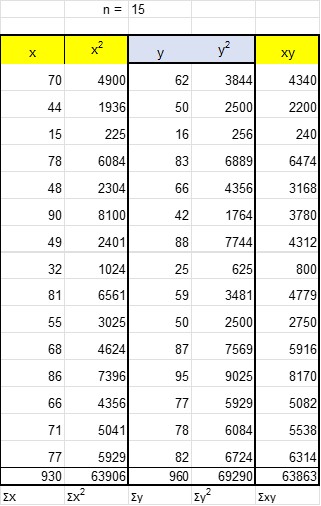
Substitute into the equation and calculate:
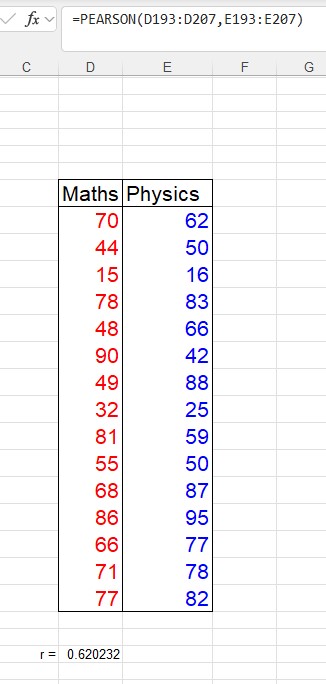
r = 0.6202
Since r > 0.5, there is a strong, positive relationship between scoring well in maths and physics.
The Excel formula =PEARSON(range_x, range_y) will return the value of r.
Sticking with the data givenfor the maths and physics scores, and using the line of best fit with equation y = 11/16 x + 21:
How well does the data fit the predicted line?
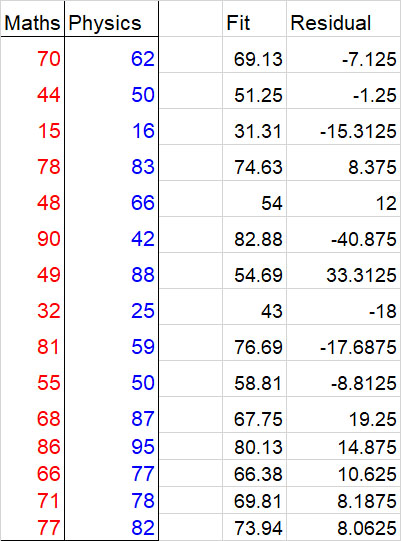
The residuals (or deviations) can be examined to see how good the fit is.
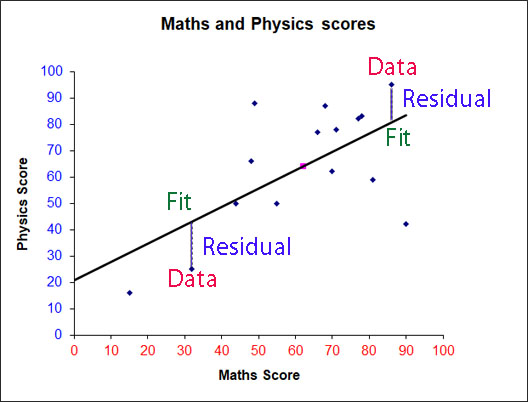
Plotting the x‑values against the y‑residuals gives:
An equal amount of data above and below the line shows that the line of best fit calculated is not too bad a fit.
Hypothesis testing draws conclusions about an entire population based on a representative sample.
H0 is the Null Hypothesis — usually a statement that no relationship, effect or difference exists.
HA (or H1) is the Alternative Hypothesis — usually a statement that a relationship, effect or difference does exist.
H0 and HA are mutually exclusive.
A result is statistically significant if it allows the null hypothesis to be rejected.
The p‑value is the probability that a given result would occur under the null hypothesis. A low p‑value means the result is unlikely if H0 were true.
In a significance test, H0 is rejected if the p‑value is less than or equal to the significance level (α), often 0.05.
Using the data from the Line of Best Fit section:
H0: μmaths = μphysics
HA: μmaths ≠ μphysics
α = 0.05
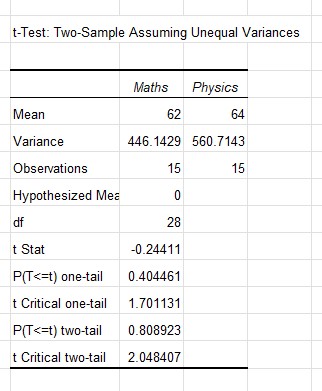
The test statistic t = −0.24411
The p‑value (two‑tailed) = 0.808923
Since p > α and |t| is less than the critical value, we fail to reject H0. There is no significant difference between the means — being good at maths does suggest being good at physics!
Confidence levels — belief that a statistical result is true — are usually expressed as a percentage, often 95% or 99%.
A 95% confidence level means we are 95% sure the result is not due to chance or sampling error.
Confidence intervals are ranges of values that contain the true population parameter with a certain probability.
Formula:
confidence interval = sample mean ± (critical value × standard error)
The critical value depends on the confidence level and the sampling distribution. The standard error is the standard deviation of the sampling distribution, estimated by:
standard error = σ / √n
The lower and upper bounds of the confidence interval indicate the range of values likely to contain the true population mean.
A one‑sample t-test is used to test whether the mean of a population is equal to a particular value. The mean of a sample is used to estimate the true population mean.
A one‑sample t‑test always uses:
H0 : μ = μ0
The alternative hypothesis may be:
so
If the p‑value corresponding to the test statistic t with (n−1) degrees of freedom is less than the significance level α, the null hypothesis can be rejected.
A two‑sample t‑test is used to determine whether two population means are equal.
H0 : μ1 = μ2
The alternative hypothesis may be:
so
The pooled standard deviation sp is:
n1 is the count of sample 1, n2 is the count of sample 2. s1 and s2 are the standard deviations of the two samples.
A paired t‑test compares the means of two related groups of observations. It tests whether there is a significant difference between the average values of the two groups by comparing their measurements before and after an event.
The paired t‑test assumes the observations are normally distributed, independent, and have equal variances within each group.
A z‑test compares the mean of a population or sample to a hypothesised value. It assumes the population variance is known and the sample size is large enough for the sampling distribution to be approximately normal.
The p‑value depends on the direction and type of the test (one‑tailed or two‑tailed). Φ is the absolute value of the z‑score, representing the number of standard deviations from the mean.
z = (x − μ) / (σ / √n)
where x is the sample mean, μ is the hypothesised population mean, σ is the population standard deviation, and n is the sample size.
Test whether the average height of adult males in the UK differs from 175 cm, using a sample of 100 men with mean height 173 cm and population SD 10 cm.
H0: μ = 175
HA: μ ≠ 175
z = (173 − 175) / (10 / √100) = −2
p = 2 × Φ(−|z|) = 2 × Φ(−2) ≈ 0.046 Since p < 0.05, reject H0.
