Sketching the Graph of a Derived Function
At the stationary points of a function \(f(x)\), the derivative \(f'(x)\) is always zero.
This means the graph of \(f'(x)\) will cut the x‑axis whenever \(f(x)\) has a maximum, minimum, or point of inflection.
To sketch the graph of a derived function:
- Locate the stationary points of \(f(x)\). Mark these x‑values on the x‑axis.
- Determine the nature of each stationary point:
- If the gradient is increasing → \(f'(x) \gt 0\) → graph lies above the x‑axis.
- If the gradient is decreasing → \(f'(x) \lt 0\) → graph lies below the x‑axis.
- Mark the key points and sketch the general shape of \(f'(x)\).
Example
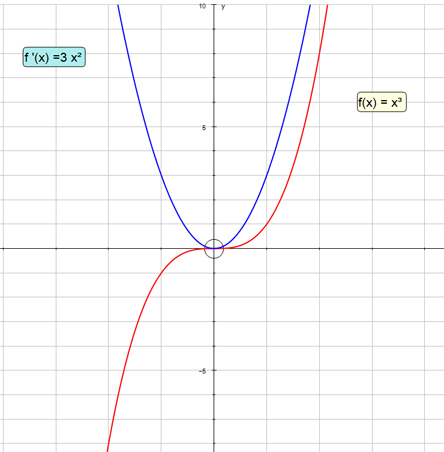
The graph of a function is shown. Sketch the graph of the derived function.
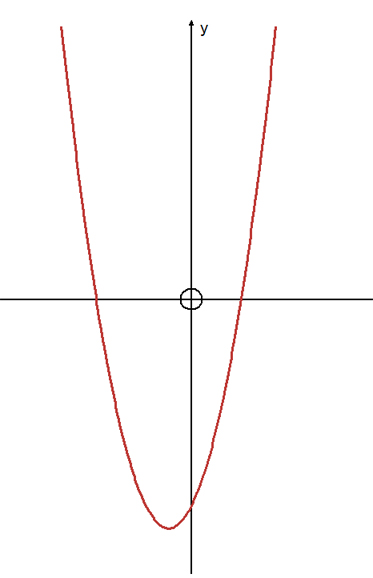
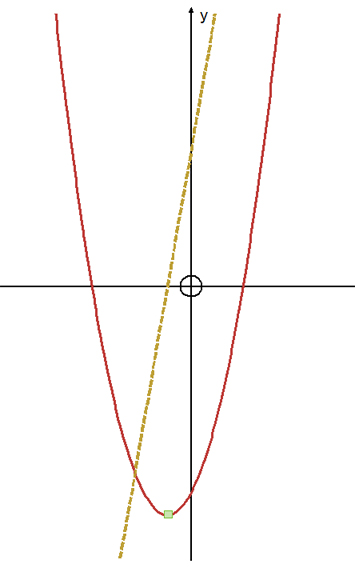
The function has a minimum turning point, so the derived function will cut the x‑axis at this point.
To the left of the turning point the function is decreasing → slope negative → \(f'(x)\) lies below the x‑axis.
To the right of the turning point the function is increasing → slope positive → \(f'(x)\) lies above the x‑axis.
Example
Example
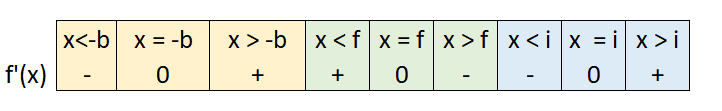
The graph of a function \(f\) intersects the x‑axis at \((-a,0)\), \((h,0)\), and \((k,0)\), and the y‑axis at \((0,d)\).
There are minimum turning points at \((-b,c)\) and \((i,j)\), and a maximum turning point at \((f,g)\).
Sketch the graph of the derived function \(f'(x)\).
Inspecting gradients: