Curve Sketching
To sketch the graph of a function
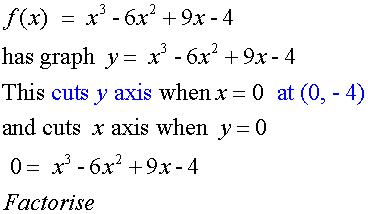
- Find the y-intercept by setting the x value to 0. Mark point on graph.
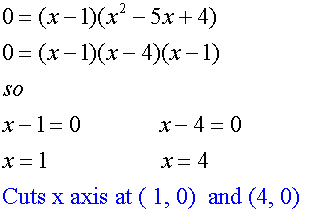
- Find the x-intercept by setting the y value to 0 Mark point on graph.
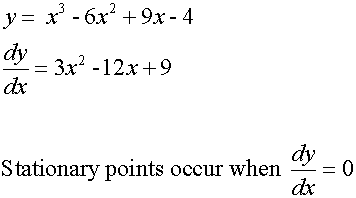
- Find the stationary points by differentiating f(x)
- Investigate the nature of these stationary points
- If the gradient is increasing, then decreasing, the turning point is a maximum.
- If the gradient is decreasing, then increasing, the turning point is a minimum.
- If gradient is decreasing, then decreasing again or
increasing and increasing again, the turning point
is a point of inflection
- Mark points on graph and lightly sketch shape of tp .
- Investigate the behaviour of the curve
- For the upper and lower ends of any closed interval.
Or - For ∞ and -∞
- For the upper and lower ends of any closed interval.
- Join up the curve.
Example
Sketch the graph of the function f(x) = x3 – 6x2 +9x - 4

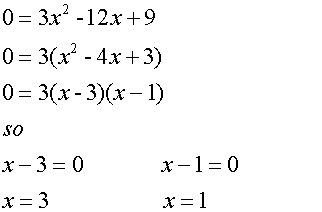
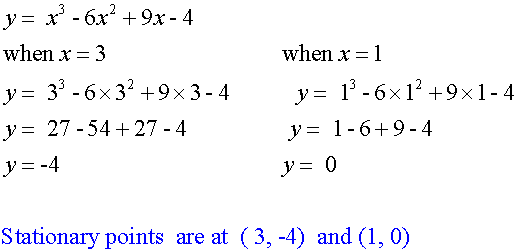

Hence ( 1, 0) is a maximum and ( 3 , -4) is a minimum
This is an open interval, since no restrictions have been placed.


