Co‑ordinates
This topic explains how to read and plot points in 2D and 3D, and how polar co‑ordinates work.
This grid method of describing direction and position is the work of the 17th‑century French philosopher and mathematician René Descartes.
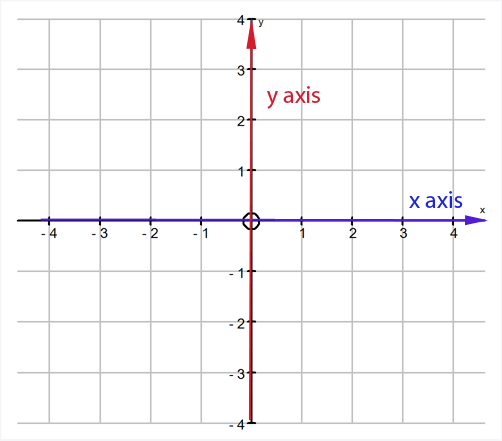
The x‑axis runs horizontally.
The y‑axis runs vertically.
They cross at the origin, \(O\).
Co‑ordinates are written as \((x, y)\), with the x‑value first.
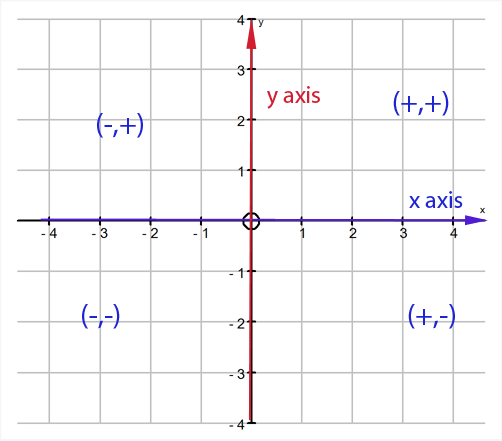
Points to the right of zero have positive x‑values.
Points above zero have positive y‑values.
Reading Cartesian Co‑ordinates
- Start at the origin.
- Move along or back to get the x‑value.
- Move up or down to get the y‑value.
- Write the pair in brackets with a comma.
Example
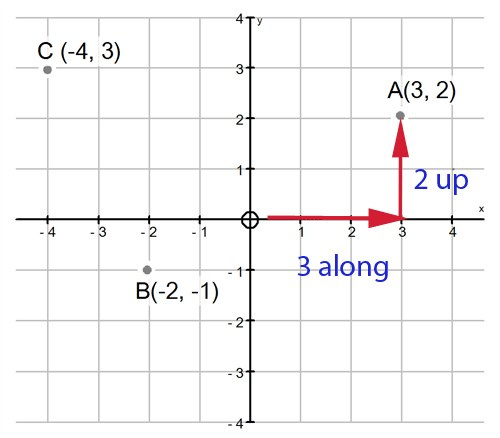
A is the point \((3, 2)\): 3 units along, 2 units up.
B is the point \((-2, -1)\): 2 units back, 1 unit down.
C is the point \((-4, 3)\): 4 units back, 3 units up.
Plotting Cartesian Co‑ordinates
- Start at the origin.
- Move along/back for x.
- Move up/down for y.
- Place a dot and label it.
Example
Plot the point \(G(3, -2)\).
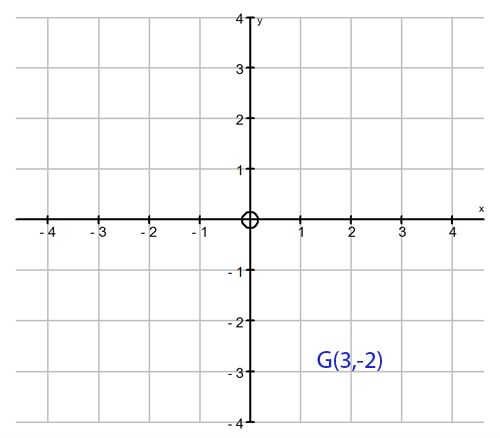
G is 3 units to the right and 2 units down.
Remember:
x along, y to the sky.
Along the corridor, then up the stairs.
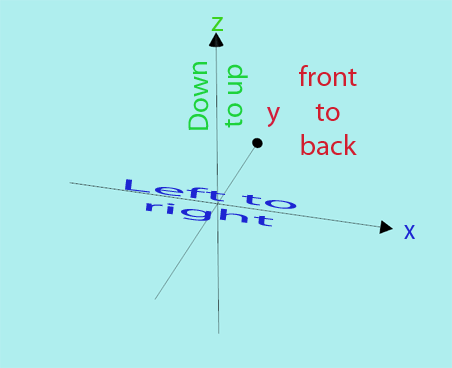
In 3D:
- x runs left–right
- y runs in–out of the page
- z runs up–down
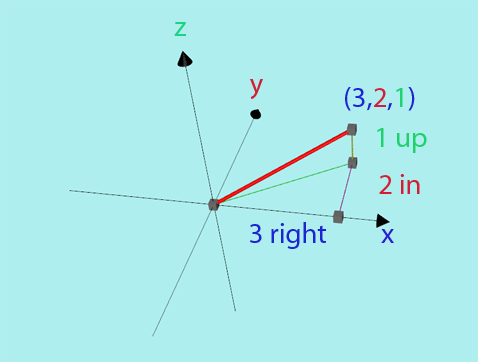
3D co‑ordinates are written as \((x, y, z)\).
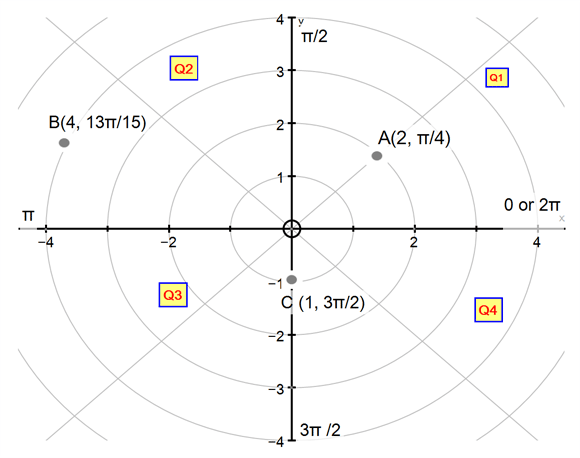
Each point is identified by a length and an angle.
Polar co‑ordinates are written as \((r, \theta)\), where:
- \(r\) is the distance from the origin (always positive)
- \(\theta\) is the angle measured anticlockwise from the x‑axis
Examples
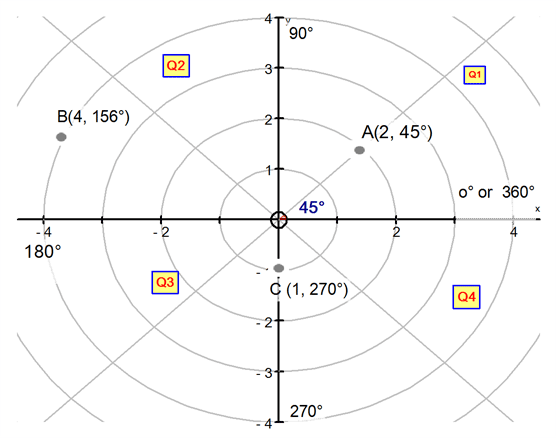
A has co‑ordinates \((2, 45^\circ)\): length 2, angle \(45^\circ\).
B has co‑ordinates \((4, 156^\circ)\): length 4, angle \(156^\circ\).
This is the same idea used in the CAST diagram for trigonometry.
Interactive – CAST Diagram
